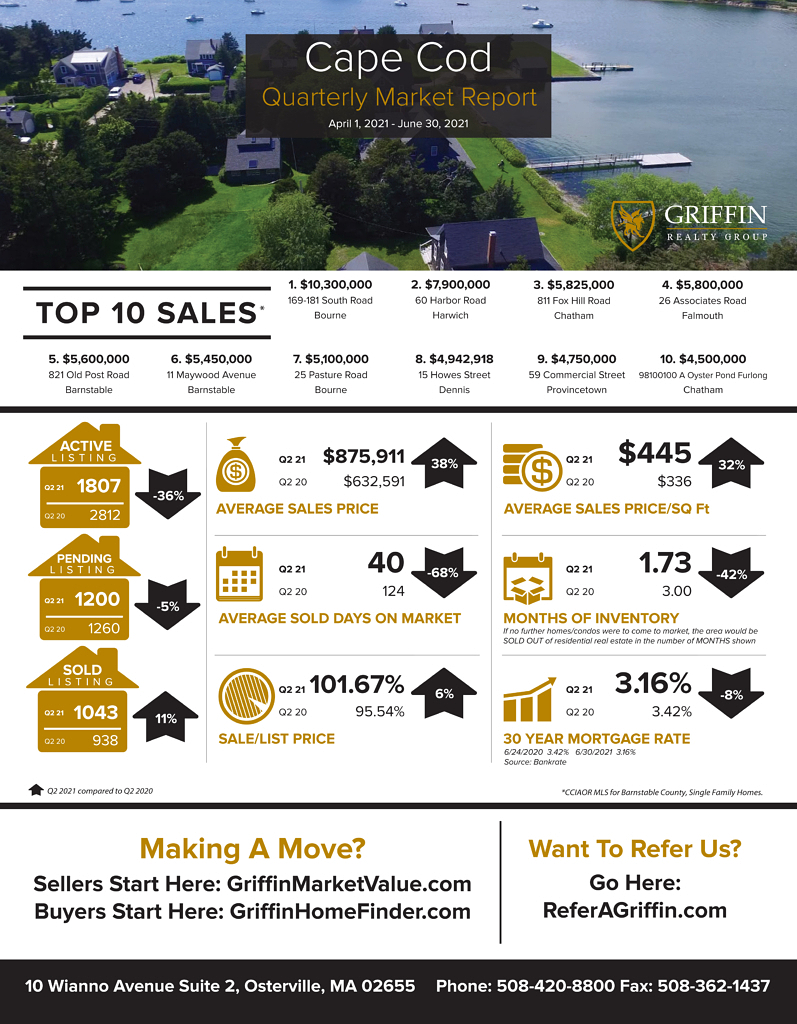
Cape Cod
Average Sales Price
Q2 2020 – $632591
Q2 2021 – $875911
38% up
Average Days On Market
Q2 2020 – 124
Q2 2021 – 40
68% down
Average Sale Price Per Square Foot
Q2 2020 – $336.48
Q2 2021 – $445.07
32% up
Sale to List Price Ratio
Q2 2020 – 95.54%
Q2 2021 – 101.67%
6% up
Number of Sold Listings
Q2 2020 – 938
Q2 2021 – 1043
11% up
Months Supply of Inventory
Q2 2020 – 3
Q2 2021 – 1.73
42% down
Mortgage Rate
Q2 2020 – 3.42%
Q2 2021 – 3.16%
8% down
Top 10 Sales
- $10300000 169-181 South Road Bourne, MA
- $7900000 60 Harbor Road Harwich, MA
- $5825000 811 Fox Hill Road Chatham, MA
- $5800000 26 Associates Road Falmouth, MA
- $5600000 821 Old Post Road Barnstable, MA
- $5450000 11 Maywood Avenue Barnstable, MA
- $5100000 25 Pasture Road Bourne, MA
- $4942918 15 Howes Street Dennis, MA
- $4750000 59 Commercial Street Provincetown, MA
- $4500000 98100100 A Oyster Pond Furlong Chatham, MA
GRAB OUR FREE COURSES
 6 Steps To Home Buyer Success 7 Steps To Home Seller Plan 8 Steps To Agent Success