Welcome to The Griffin Real Estate Market Update. If you’re thinking about buying or selling residential real estate, it’s important to understand the current market trends. According to Stellar MLS, the marketplace for Sarasota residential properties here’s what happened in October 2022 versus September 2022: Sarasota Average Sales PriceSeptember 2022 – $685590October 2022 – $6950301% […]
continue reading
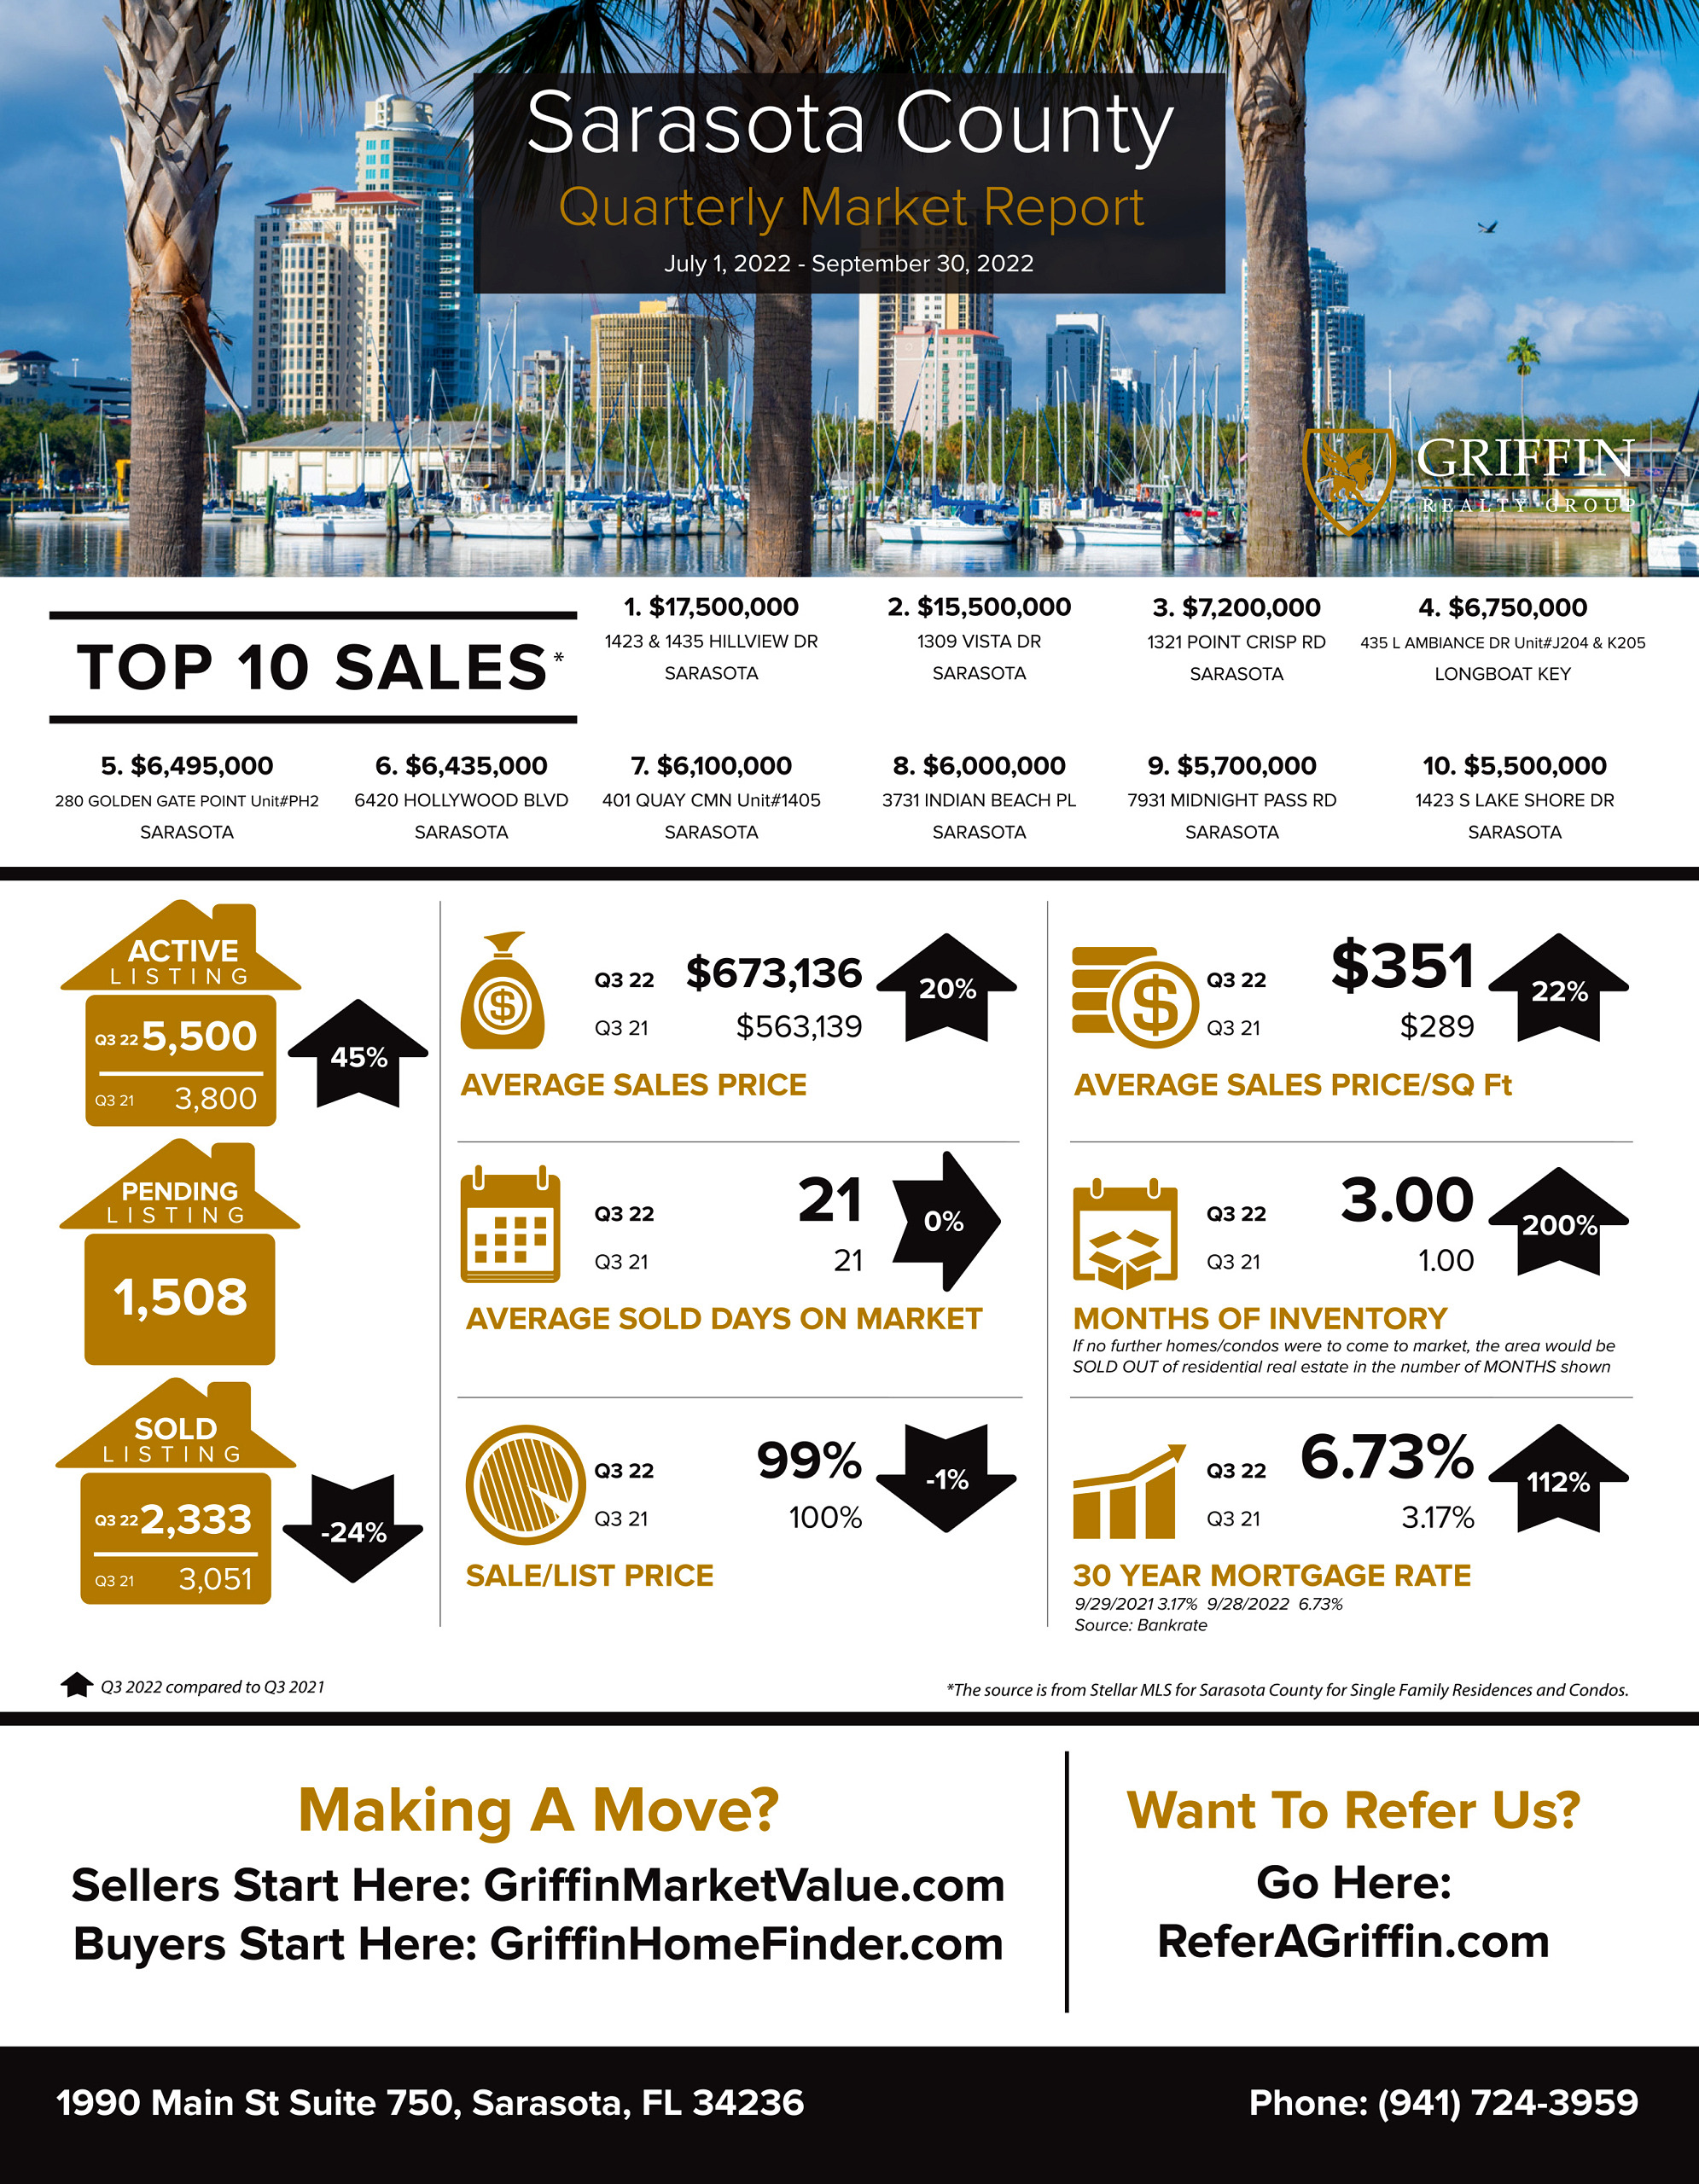
Welcome to The Griffin Real Estate Market Update. If you’re thinking about buying or selling residential real estate, it’s important to understand the current market trends. According to Stellar MLS, the marketplace for Sarasota residential properties, here’s what happened in Q3 2022 versus Q3 2021: The Number of SOLD listings decreased by 24% to 2333 […]
continue reading
Welcome to The Griffin Real Estate Market Update. If you’re thinking about buying or selling residential real estate, it’s important to understand the current market trends. According to Stellar MLS, the marketplace for Sarasota residential properties, here’s what happened in April 2022 versus March 2022: The Number of SOLD listings decreased by 7% to 1031 […]
continue reading
Welcome to The Griffin Real Estate Market Update. If you’re thinking about buying or selling residential real estate, it’s important to understand the current market trends. According to Stellar MLS, the marketplace for Sarasota residential properties here’s what happened in February 2022 versus January 2022: The Number of SOLD listings decreased by 7% to 783 […]
continue reading
Welcome to The Griffin Real Estate Market Update. If you’re thinking about buying or selling residential real estate, it’s important to understand the current market trends. According to Stellar MLS, the marketplace for Manatee residential properties, here’s what happened in October 2021 versus September 2021: The Number of SOLD listings decreased by 5% to 738 […]
continue reading
Welcome to The Griffin Real Estate Market Update. If you’re thinking about buying or selling residential real estate, it’s important to understand the current market trends. According to Stellar MLS, the marketplace for Sarasota residential properties, here’s what happened in October 2021 versus September 2021: The Number of SOLD listings decreased by 4% to 949 […]
continue reading
Welcome to The Griffin Real Estate Market Update! If you’re thinking about buying or selling residential real estate, it’s important to understand the current market trends. According to Stellar MLS, the marketplace for Manatee residential properties, here’s what happened in Q3 2021 versus Q3 2020: The Number of SOLD listings decreased by 13% to 2355 […]
continue reading
Welcome to The Griffin Real Estate Market Update. If you’re thinking about buying or selling residential real estate, it’s important to understand the current market trends. According to Stellar MLS, the marketplace for Sarasota residential properties, here’s what happened in Q3 2021 versus Q3 2020: The Number of SOLD listings decreased by 12% to 2980 […]
continue reading
Welcome to The Griffin Real Estate Market Update! If you’re thinking about buying or selling residential real estate, it’s important to understand the current market trends. According to Stellar MLS, the marketplace for Manatee residential properties here’s what happened in August 2021 versus July 2021: The Number of SOLD listings decreased by 10% to 754 […]
continue reading